The gap between the average home price in the beach cities and the national average has grown significantly since 2000. In 2000 you could buy a home in most parts of the country for $120,000 compared to $532,000 for the three beach cities and El Segundo. Since then, our blistering appreciation rates have resulted in a substantially higher gap. The National Association of Realtors estimates that the selling price of a home in the country is about $250,000 while here the average home price for all home types exceeds $1.4 million. This has had a huge impact on local businesses and on property tax revenues for the cities.
In 2016, the total sales volume of single family home, condo and townhome sales topped $2.4 billion from 1,601 sales. Assuming that the total cost of all transactions related to a sale is 6 percent, this sales volume represents $142 million in broker fees, escrow costs, and other expenses. An additional $71 million makes its way to the four cities in the form of property tax revenue.
The numbers were quite different here back in 2000. For starters, the total number of transactions was 34 percent higher at 2,421. Total sales volume came in around $1.3 billion, which when adjusted for inflation would be about $1.8 billion in today’s dollars.
With respect to the number of transactions, we would hit a post-2000 peak in 2002 with about 2,600 sales. Not surprisingly, the number of homes sold would plummet to just under 1,200 in 2008 when the national financial crisis had a firm grip on the economy. The number of annual sales has held steady at about 1,600 for the past five years. Affordability and a fall-off in turnover probably explain why we haven’t seen over 2,400 home sales in many years and may not for years to come.
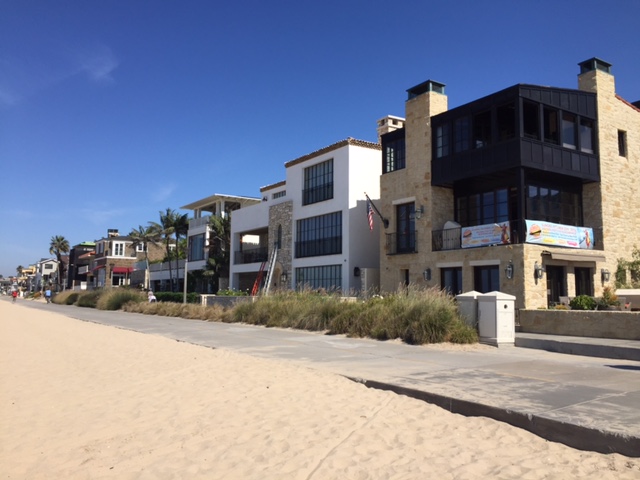
At the city level, average annual appreciation rates have ranged from 4.5 percent to close to 7 percent for the four cities since 2000. The local Multiple Listing Service (MLS) for the South Bay further breaks down the cities into 17 total different areas in El Segundo, Manhattan Beach, Hermosa Beach and Redondo Beach. Every single area has had average annual appreciation of at least 5.6 percent to 6.9 percent with one exception, the Manhattan sand section. Median sales prices in the Manhattan sand section have increased an average of 9 percent per year every year since 2000. This can be partly explained by the fact that 26 percent of homes sold near the beach in this section during the first six months of this year were built within the past two years and sold for a median price of $4.5 million.
All 17 areas were hit hard in 2007 and 2008 during the credit crisis and median sales prices took a big hit. With the benefit of hindsight, we now know that the market would start to recover a few years later. Average annual appreciation rates become far more impressive from 2011 through the first half of this year for every area with a range of 5.6 percent up to an incredible 13.6 percent.
Of the 17 areas, six have experienced average annual appreciation rates over 10 percent. The Manhattan sand section leads the pack at 13.6 percent. South Redondo west of PCH came in at 13 percent. The others include the tree section of Manhattan, both areas in east Manhattan, and the area in south Redondo Beach north of Torrance Blvd.
In spite of a few tough years since 2000, homeowners here have enjoyed a tremendous ride with respect to home appreciation rates.


